Suppose we want to create a simple Life Insurance pricing model, as presented in Actuarial Mathematics.
Given a set of assumptions, we wish to find the expected value of Life Insurance benefits, discounted to present value.
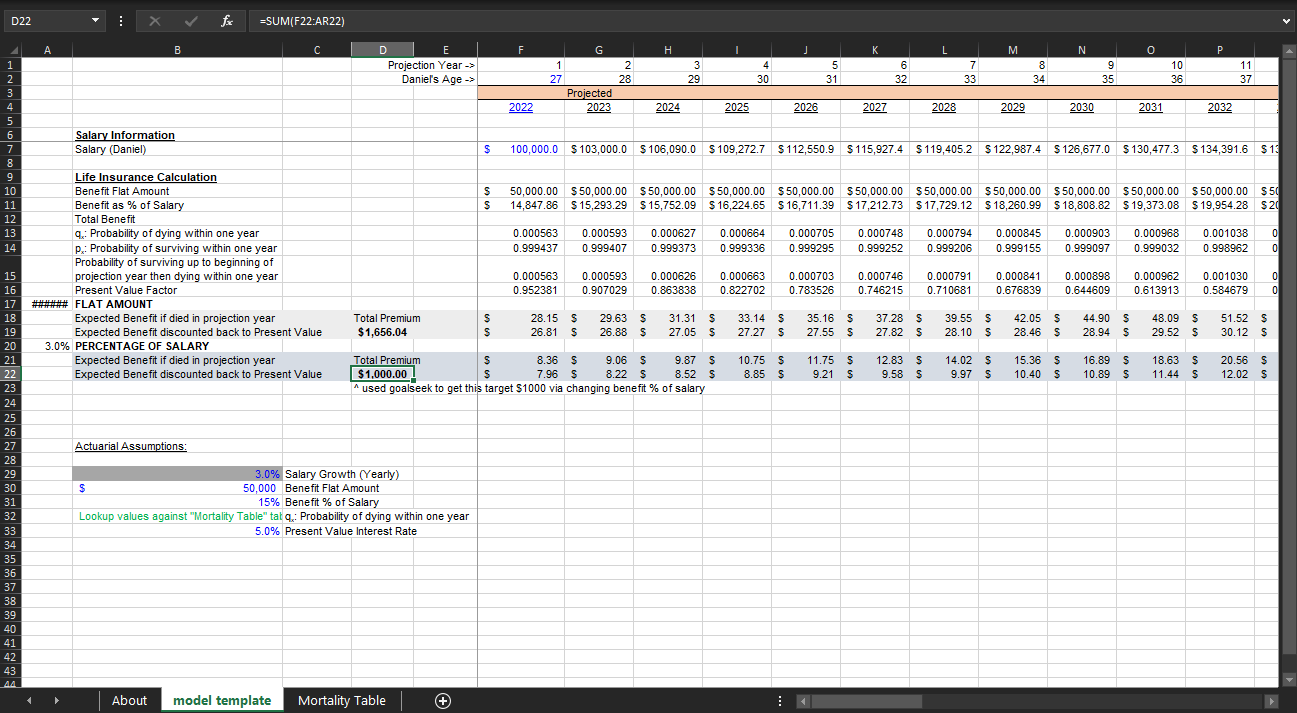
Suppose then we have the following assumptions:
Life Insurance Policy A: Pays a flat benefit amount of $50,000 in case of death (up to age 65)
Life Insurance Policy B: Pays X% of yearly salary in case of death (up to age 65)
Salary @ age 27: $100,000
Benefit Flat Amount: $50,000
Benefit as % of Salary = X%
Probability of dying within one year = (pulled from mortality table https://www.ssa.gov/oact/STATS/table4c6.html )
Risk-free Interest Rate: 5%
Total Premium = sum of expected benefits, discounted to 2022
Our task is to objectively compare Policy A and Policy B as well as understand their relative pricing structures. In addition, suppose we want to keep the total premium for Policy B at $1000.
Intuitively, we can build a dynamic spreadsheet and goalseek the total premium by changing benefit amounts (or percentage of salary).
To view this in detail, you can download my workbook (.xlsx) here. Or, view it on Google Spreadsheets (data values only).